Brilliant Invention Gen 20 Hydrogen Generator July 2 2026
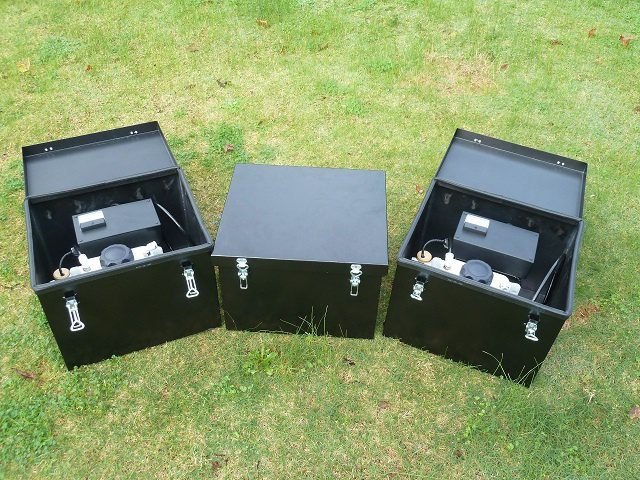
Brilliant Invention Gen 20 Hydrogen Generator ---(update Feb 7... Full Story
Perth, West Australia





by Gavan Knox MSc, BSc, BEd.
WhatsApp call +61 403177183
contact gavan@hfuel.com.au
https://hydrogenfuelsystems.com.au
Fuel prices do not need to climb very far before a high-use vehicle starts costing serious money. A hydrogen generator return on investment is therefore not a theory exercise for owner-drivers, fleet managers or machinery operators. It is a practical calculation: how much fuel does the engine burn now, what can improved combustion save, and how quickly can those savings recover the cost of the system?
For vehicles that cover limited kilometres or only run occasionally, payback can take time. For a diesel ute on the road every day, a truck hauling loads, a marine engine working long hours or a generator consuming fuel week after week, the numbers can become compelling quickly. The key is to calculate from your real fuel records, not optimistic guesses.

An on-board hydrogen generator, often called an HHO kit, produces a hydrogen and oxygen gas mixture to supplement the engine’s intake charge. The intended result is a more complete and efficient combustion event. When the engine is properly matched, installed and tuned, operators look for lower fuel use, cleaner combustion, improved throttle response and reduced build-up associated with inefficient burning.
The return comes primarily from fuel saved, but fuel is not the only cost line worth watching. A vehicle or machine that runs cleaner may also offer operational gains through better engine response and less unwanted carbon accumulation. Those potential maintenance benefits should be treated as a secondary upside, not used to artificially inflate a payback calculation before they are documented in your own operation.
Your result depends on five practical variables: current fuel consumption, fuel price, operating hours or kilometres, the installed cost of the system, and the verified reduction in fuel use after installation. Engine condition, load profile, driving style, vehicle aerodynamics and maintenance all affect the final outcome.
A heavily loaded truck with stable highway kilometres may produce a more consistent result than a passenger car doing short suburban trips. Likewise, a generator carrying a steady load is easier to measure than a 4WD that alternates between commuting, towing and off-road work. The more consistent the duty cycle, the cleaner the comparison.
Start with a baseline covering enough time to mean something. A single tank of fuel is not a baseline. Record at least several fill cycles, or a defined month of operating data, including litres purchased, kilometres travelled or hours run, the fuel price paid and the type of work performed.
For road vehicles, calculate litres per 100 kilometres:
Litres used ÷ kilometres travelled × 100 = L/100 km
For stationary equipment, generators and marine applications, calculate litres per hour:
Litres used ÷ operating hours = L/hour
Once the baseline is clear, calculate current fuel spend over a realistic period. If your truck uses 40 litres per 100 km, covers 80,000 km a year and diesel costs $2.00 per litre, annual fuel expenditure is $64,000. That is the number that matters. A modest percentage improvement on a large fuel bill is worth far more than an impressive percentage on a vehicle that only travels to the shops.
Next, apply a conservative expected fuel-saving figure. Do not build your purchase decision around the best result ever reported in a completely different application. Use test information, installation guidance and results that are relevant to your engine type and workload, then model a cautious case alongside a stronger case.
If the same truck achieved a verified 8 per cent reduction in fuel use, the annual saving on $64,000 in fuel would be $5,120. If the supplied and installed system cost $2,500, the simple payback period would be roughly 5.9 months.
Installed system cost ÷ annual fuel saving = payback period in years
For a monthly figure, divide the annual saving by 12. In the example above, $5,120 divided by 12 is about $427 per month. Divide $2,500 by $427 and the payback is just under six months.
That is simple payback, which is the most useful starting point for most operators. It tells you when the fuel savings have paid back the initial outlay. After that point, ongoing savings can improve the operating margin of the vehicle or asset, subject to the same operating conditions continuing.
A worthwhile ROI worksheet should include three columns: conservative, expected and strong. This keeps the decision grounded and makes it easier to see whether the system still makes commercial sense if fuel savings land below expectations.
Take a vehicle spending $18,000 annually on fuel with an installed system cost of $2,000. At a conservative 5 per cent saving, annual fuel savings are $900 and simple payback is about 26.7 months. At 10 per cent, annual savings rise to $1,800 and payback drops to around 13.3 months. At 15 per cent, the saving is $2,700 and payback is under nine months.
This is why fuel use is the first question worth asking. A high-consumption application has more dollars available to save. It can justify a larger system and recover the investment sooner than a lightly used vehicle, even if both achieve the same percentage improvement.
Do not calculate ROI from the kit price alone if professional installation, wiring work, accessories or vehicle-specific fitment are required. Include the complete cost to put the system into service: the generator kit, power supply components, filters, fittings, installation labour and any monitoring or tuning work required for the application.
A cheaper system that is incorrectly sized or poorly installed is not a bargain. Gas production capacity, electrical supply, mounting location, hose routing and engine compatibility all matter. Cars, trucks, 4WDs, marine engines and generators do not have the same duty cycle or space constraints. Matching the Gen 10, Gen 15, Gen 20 or Gen 25 system to the application is part of protecting your return.
The strongest proof is your own before-and-after data. Continue recording litres, kilometres or operating hours after installation, and compare similar work over a meaningful period. If a truck was hauling a heavier load, facing different terrain or running in unusually cold conditions, note it. Context stops good data from becoming misleading data.
For fleet operators, trial one or two comparable vehicles before rolling out across the fleet. Set a baseline period, use the same fuel-purchasing records, nominate a driver or supervisor to collect the information, and compare results over similar routes and loads. This gives management a defensible decision rather than a claim based on anecdotal feedback.
It also helps to watch the operational signs drivers notice first: throttle response, pulling performance, smoke behaviour and smoothness under load. These observations are useful, but they should sit alongside the fuel figures rather than replace them. The financial case rests on litres saved and dollars retained.
Be realistic about variables that can suppress results. An engine with unresolved mechanical faults, blocked filters, injector issues, intake leaks or poor servicing will not become a perfect performer simply because an HHO system is fitted. Deal with basic maintenance first. Hydrogen enhancement is designed to support combustion efficiency, not substitute for mechanical repairs.
The best candidates are generally assets with high and regular fuel use. Long-haul and regional trucks, delivery fleets, trades vehicles, towing 4WDs, boats, agricultural machinery and standby or prime-power generators all offer measurable operating hours and a material fuel spend.
A low-kilometre passenger car may still benefit from improved engine behaviour, but its payback period is usually longer because there are fewer litres available to save. That does not make the installation wrong. It simply means the buying decision may be based on a mix of fuel economy, engine performance and emissions goals rather than rapid payback alone.
Fuel price also changes the equation. As diesel or petrol prices rise, every percentage point of fuel reduction becomes more valuable and the payback period shortens. Operators should revisit their calculation when fuel costs move, particularly if the vehicle is clocking up substantially more kilometres than when the original decision was made.
Hydrogen Fuel Systems provides application-focused system options, technical material and installation support so buyers can assess fitment before committing. Ask for documentation relevant to the engine and use case, then put the figures into your own calculator. Tested information is valuable, but your workload is the one that pays the bills.
The smart move is to start with a real fuel baseline this week. Once you know exactly what each vehicle, boat or generator is costing to run, you can judge whether a hydrogen generator is merely an interesting upgrade or a cost-cutting asset that deserves to be working for you.
by Gavan Knox MSc, BSc, BEd.
WhatsApp call +61 403177183
contact gavan@hfuel.com.au
https://hydrogenfuelsystems.com.au
Brilliant Invention Gen 20 Hydrogen Generator ---(update Feb 7... Full Story

by Gavan Knox HFS whats app +61 403177183 gavan@hfuel.com.au... Full Story
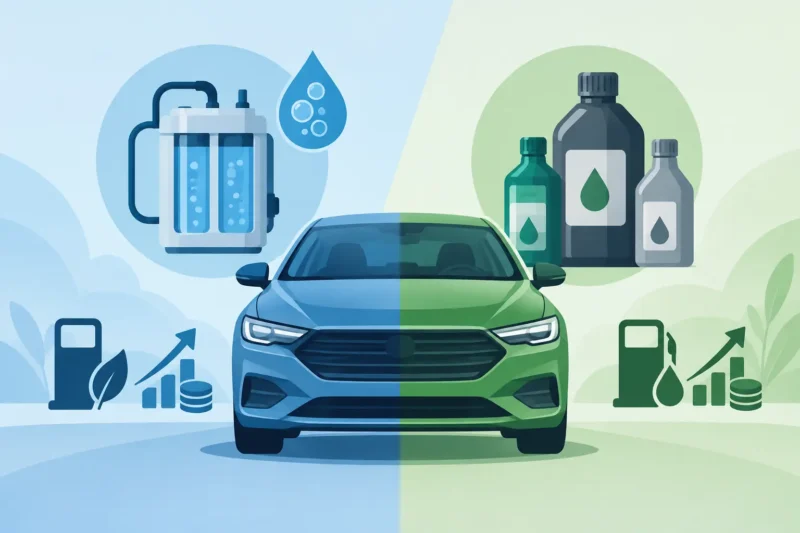
HHO Versus Additives: What Actually Pays Back? - Oct.... Full Story
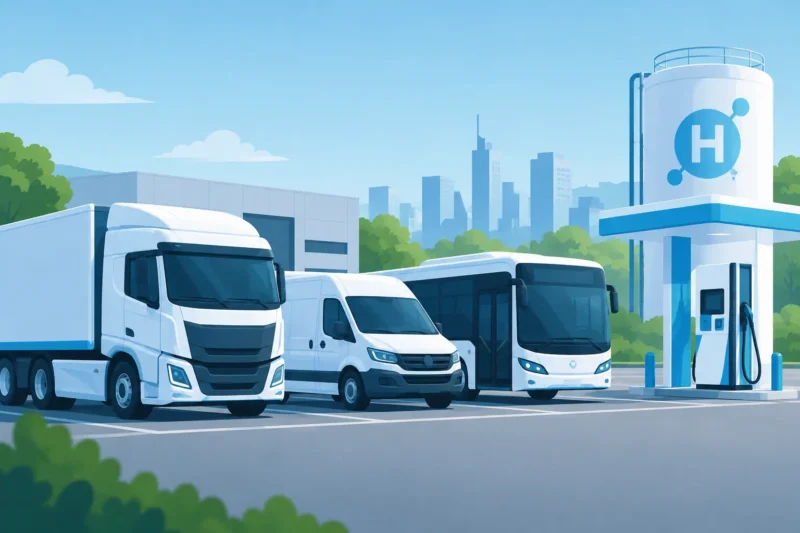
Run a Fleet Hydrogen Trial That Shows Real Results... Full Story

4WD Hydrogen Results for Hard-Working Rigs - Oct 9... Full Story
Payment Methods Partner:

© 2023 - Hydrogenfuelsystems pty ltd